Excel table design explained
At first glance, a spreadsheet looks simple: rows, columns, some data, done. But the moment your file grows, things start to fall apart. Filters stop working properly, formulas break, and finding the right value feels like a treasure hunt.
That’s exactly where tables come in, and when designed well, they completely change how you work with data.
In this article, we’ll look at how table design works and why it matters.

Why table structure really matters
A normal cell range is passive. It just sits there. A table, instead, behaves like a living object.
When you turn a dataset into a table , the editor immediately understands that your data has structure. Headers become real headers, rows belong together, and new data is automatically included without manual fixes.
This has very concrete consequences:
- Filters and sorting are always available on headers
- Formulas automatically extend to new rows
- References stay stable even when the table grows
- Your data becomes readable, not just stored
Over time, this stability matters far more than it seems at the beginning, especially in files that are reused, shared, or updated regularly.
What makes a well-designed table
Good table design isn’t about colors or fancy borders. It’s about not confusing the spreadsheet engine or the humans using it.
A solid table follows a few simple rules:
- Headers are clear and descriptive (no “Data1”, “Value”, or “Stuff”)
- Each column contains one type of data only (dates stay dates, text stays text)
- No empty rows or columns inside the table
- Related information is grouped logically
- Formatting helps reading instead of screaming for attention
If you ever had a formula fail “for no reason”, chances are the table design was the real problem.
Seeing tables in action
To understand why table design matters, it helps to look at real scenarios instead of abstract rules. Let’s see a couple of examples using ONLYOFFICE Spreadsheet Editor.
Example 1: Project tracking table
Imagine a small project management file with tasks, deadlines, and statuses.
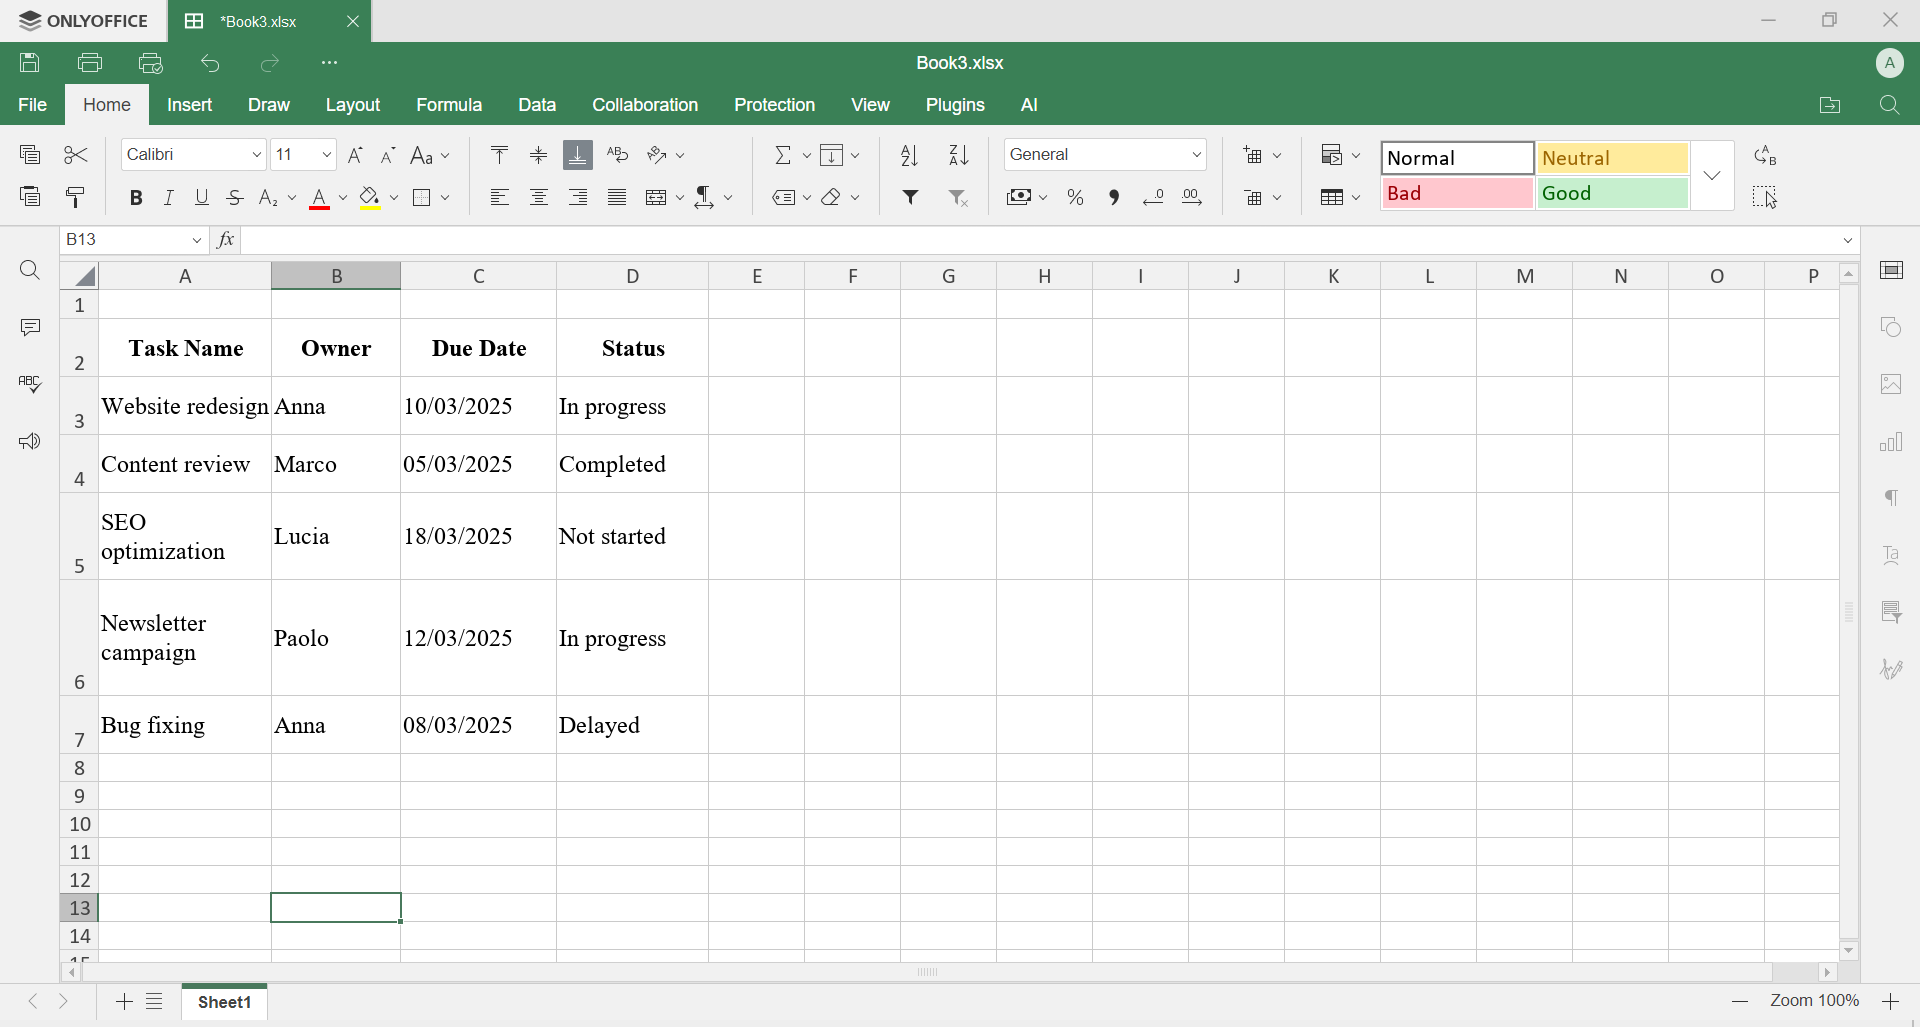
As a simple range, it’s fragile. As a table, it becomes manageable.
Select the needed ranges, then go to Insert > Table. If you want, you can color, format and style in the Home tab.
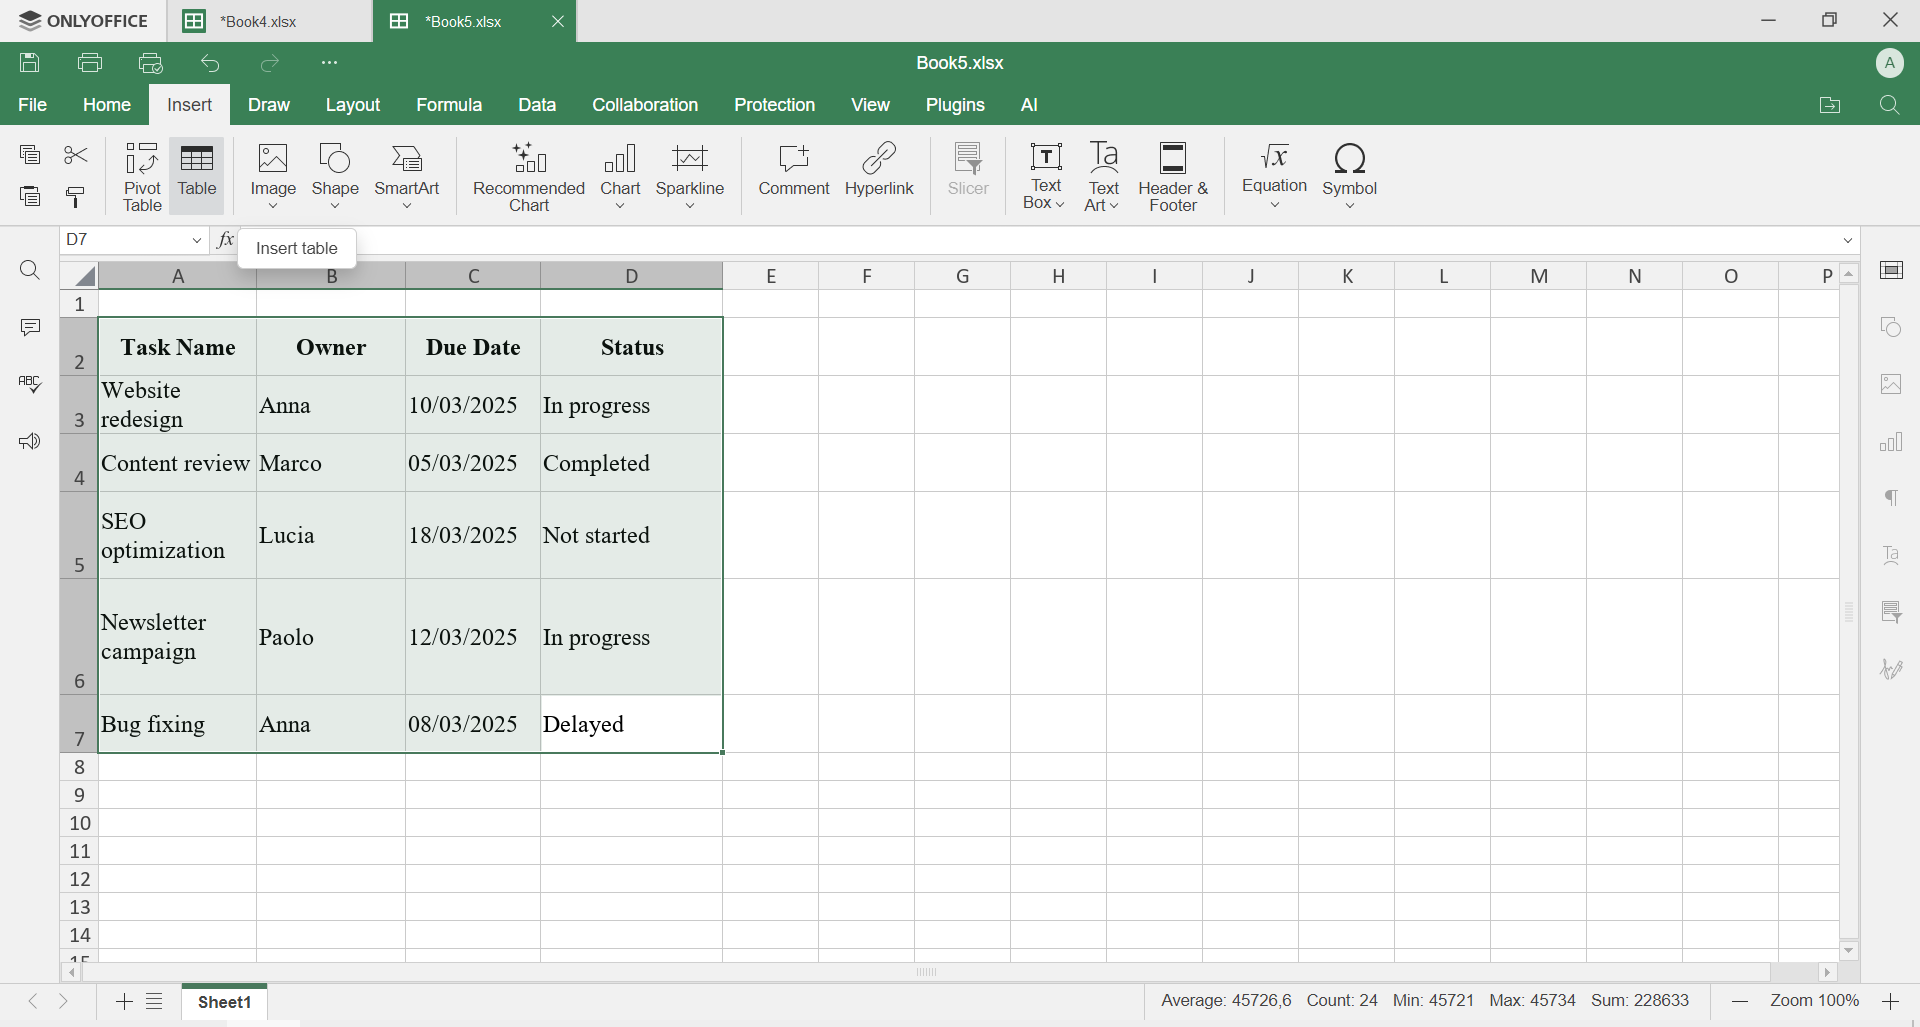
Now you can:
- Filter tasks assigned to a specific person

- Sort by due date to see what’s urgent

- Highlight overdue items with conditional formatting

- Add new tasks without touching existing formulas or layout
This is a perfect example of how table design turns a static list into a working tool.
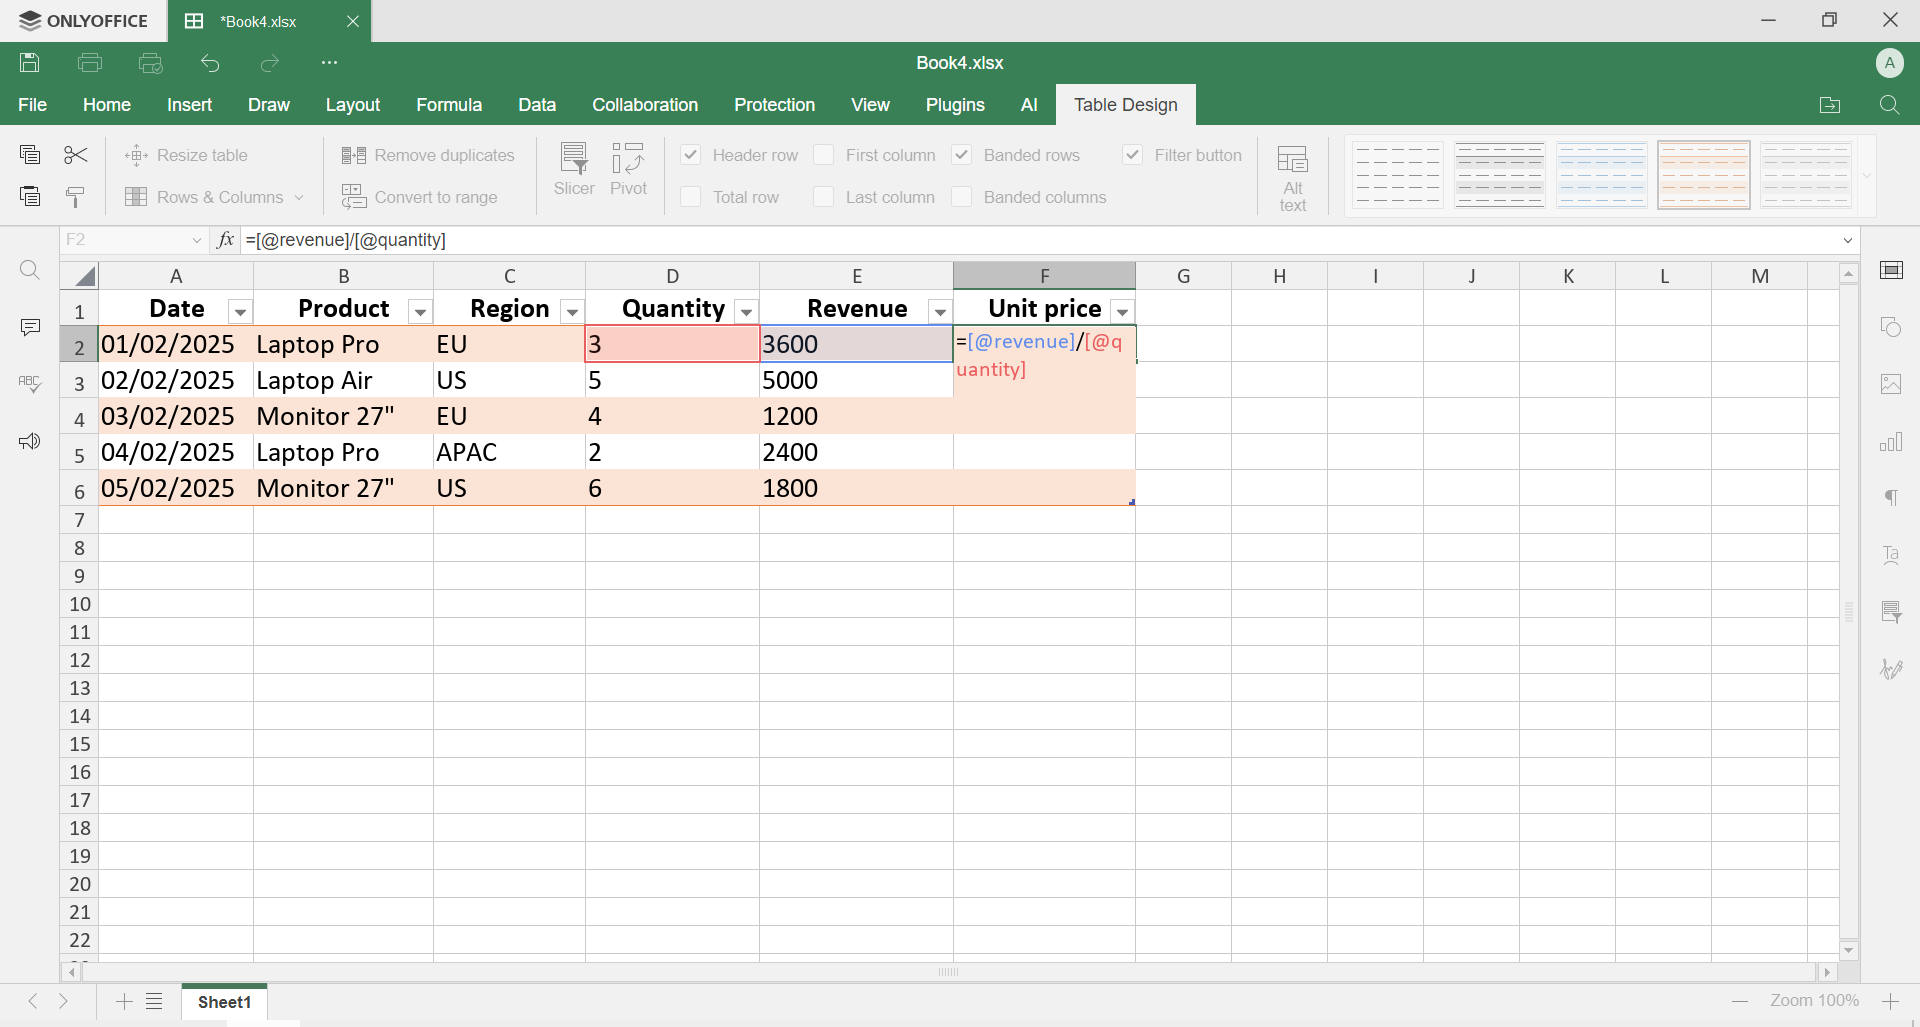
Example 2: Sales data table
Now think of a sales report with columns like Date, Product, Region, Quantity, and Revenue.
As a table:
- You can quickly filter by product or region
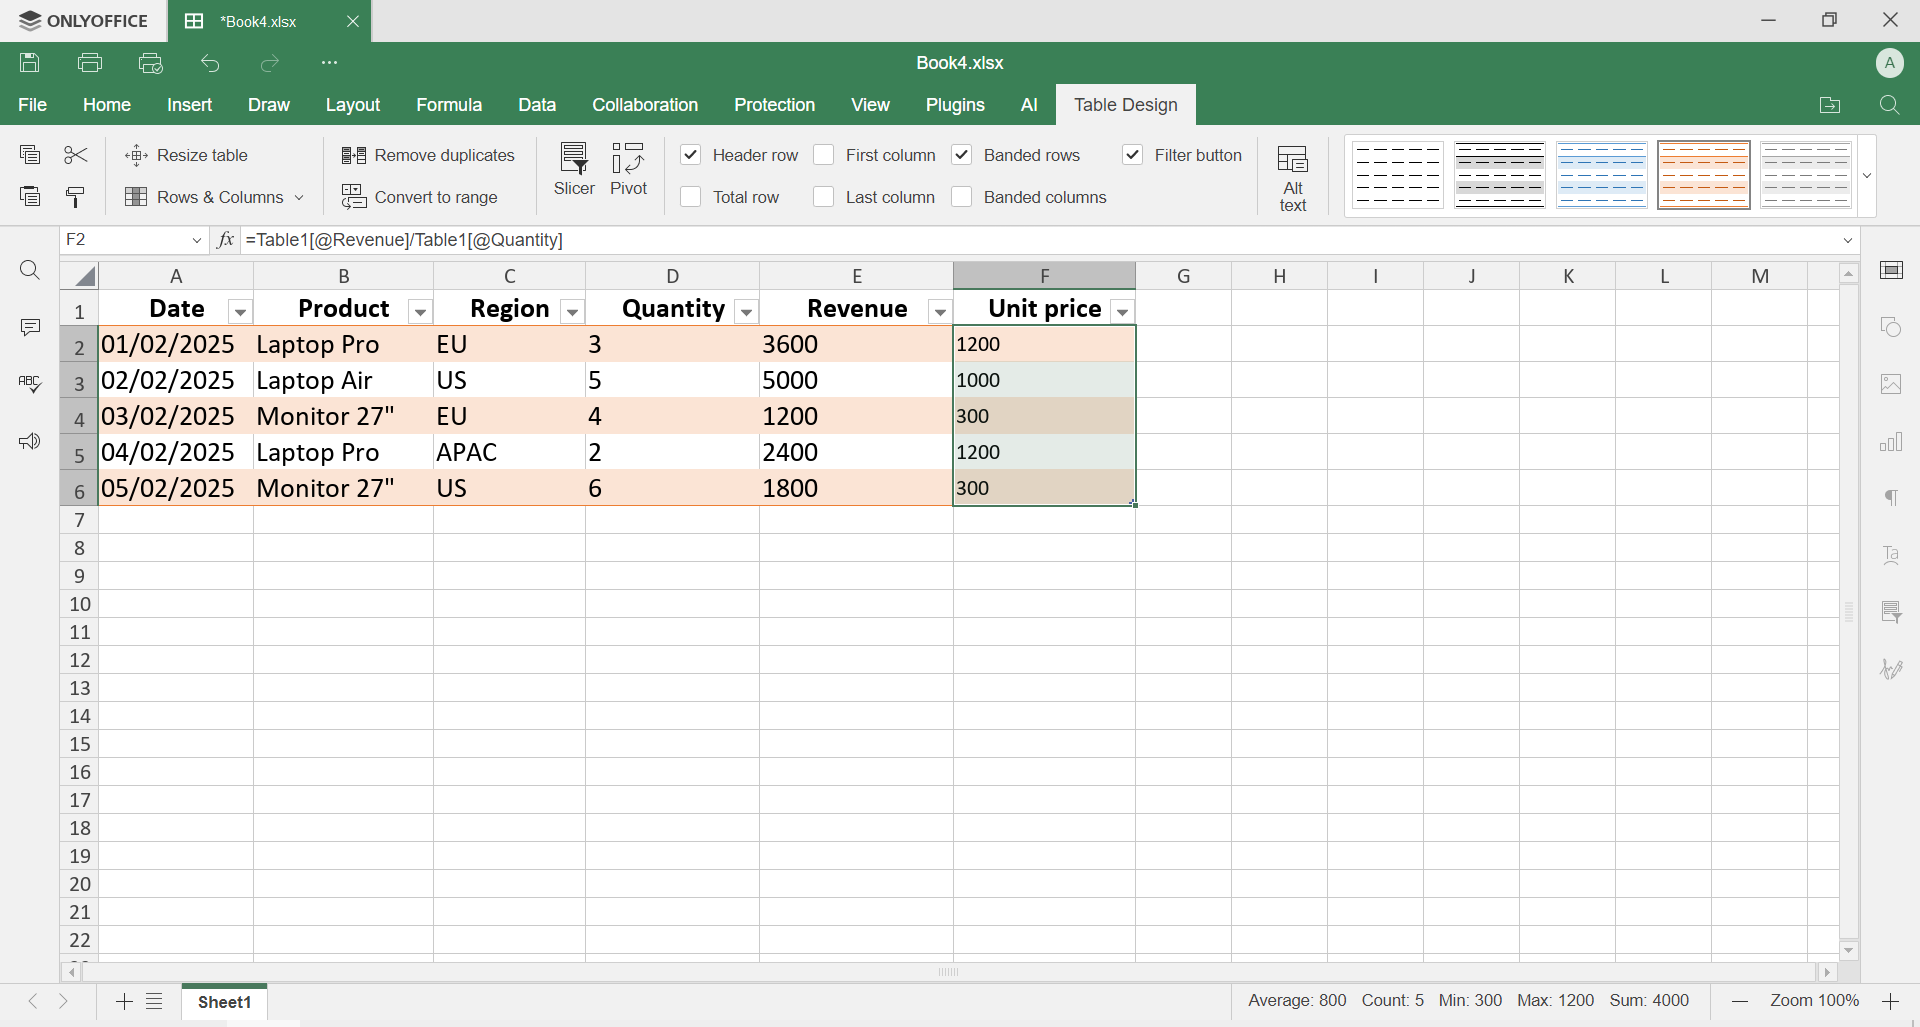
- Structured references make formulas easier to read
- The dataset is ready for Pivot Tables without extra cleanup
- Visual formatting can highlight top-performing products or weak areas
Same data, but completely different experience when using tables.
Why table design saves time
A well-designed table reduces errors, makes formulas predictable, and lets you focus on analysis instead of fixing broken ranges. You stop fighting the spreadsheet and start using it.
Most spreadsheet problems don’t come from complex formulas, they come from bad structure. Tables fix that at the root.
Try it yourself in ONLYOFFICE Spreadsheet Editor
Want to put what you’ve learned about table design into practice? Open ONLYOFFICE Spreadsheet Editor and start creating your own tables: filter, sort, add new rows, and see how the structure keeps everything organized and consistent.
If you don’t have an ONLYOFFICE account yet, create one for free and start working on real tables right away. You can use it online or download the desktop apps to work locally.
Create your free ONLYOFFICE account
View, edit and collaborate on docs, sheets, slides, forms, and PDF files online.